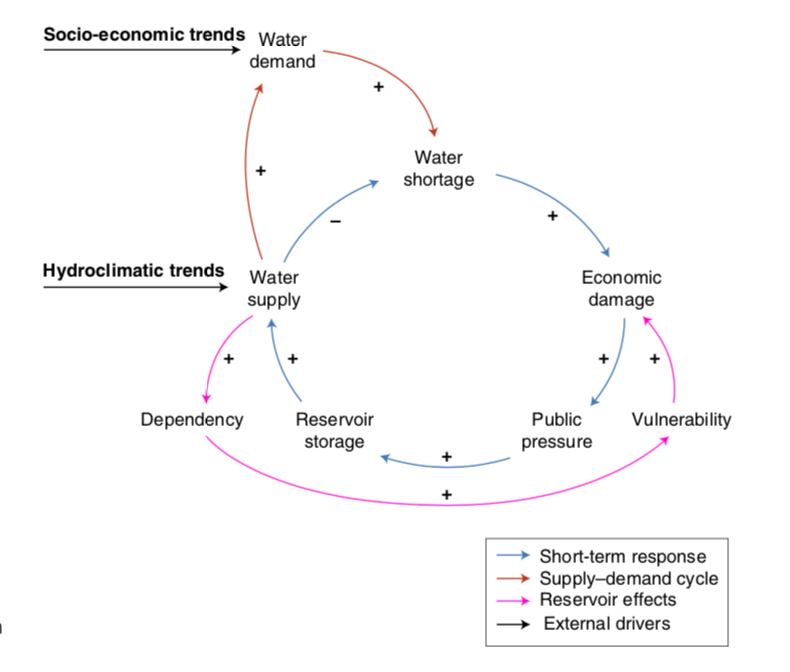
Causal Loop Diagrams

Good example of sloppy, casual notation, with excellent secondary notation; only possible because the ontology is weak
Start with a field of lettuces. Rabbits come and eat the lettuces. Lots of food means more rabbits, but soon most of the lettuces have been eaten and the rabbits decline in number for lack of food. As the rabbit numbers dwindle the lettuces pick up again; then the rabbits multiply, and so it goes, round and round.
Unlike most of the notations we have mentioned, Causal Loop Diagrams (CLDs) describe things that change over time and influence each other as they change, such as rabbits and lettuces. That’s a heavily simplified example; where CLDs have proved their worth is in teasing out much more complex relationships; they are tools for exploratory understanding, just like mind maps XREF and I should mention that in mind maps. They have proved particularly fruitful as tools to explicate complex social structures, as we shall see below.